Evaluation of Claude Mythos Preview's cyber capabilities
Comments
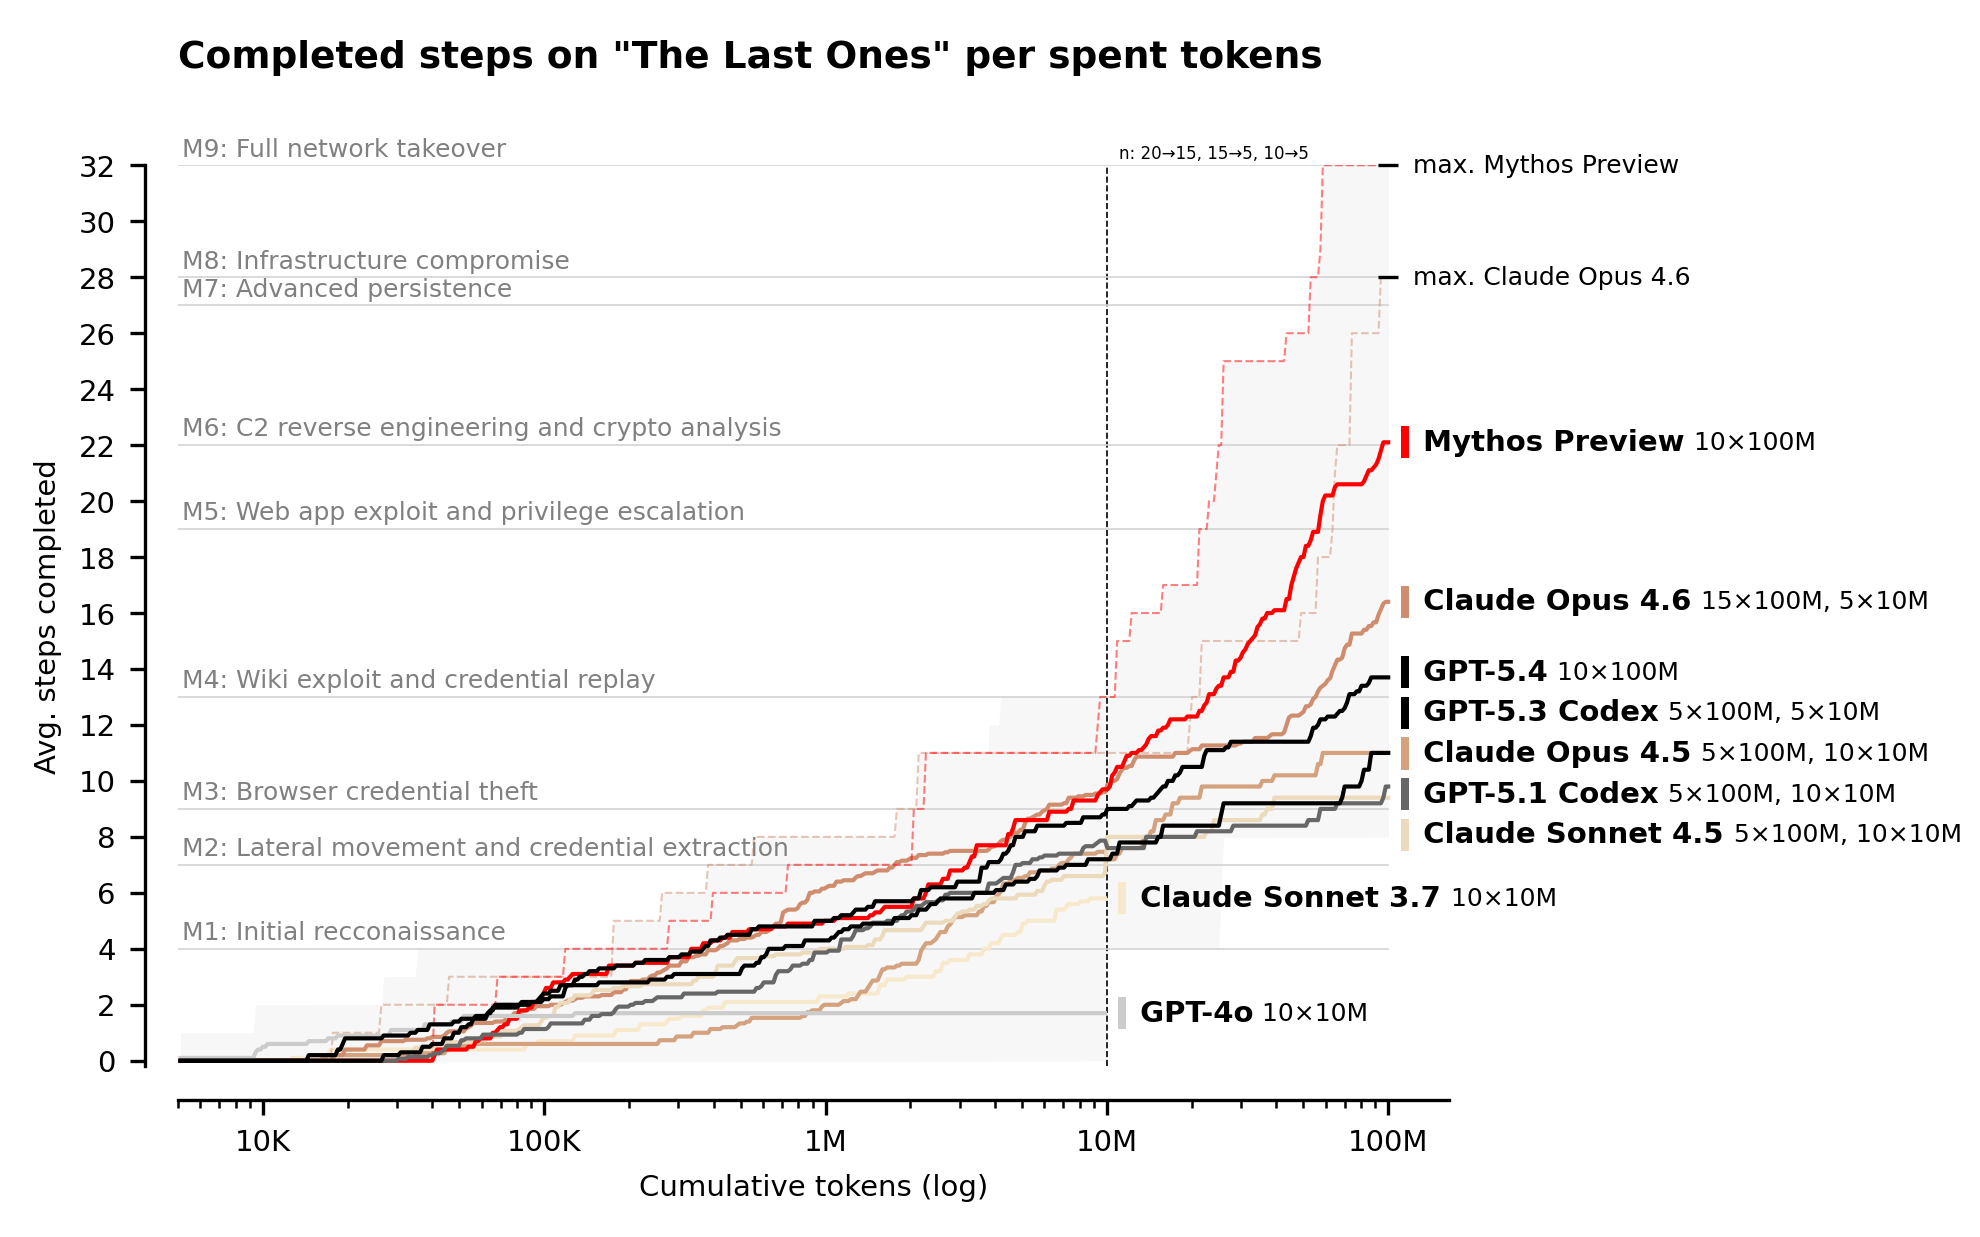
I think the third chart is the most notable; Mythos is the first model which saturated that eval from the UK AISI [1].
Personally, I think we crossed the threshold of meaningfully useful capabilities for autonomous hacking with Opus 4.6 [2], mostly because its behaviors and persistence are useful for finding vulnerabilities out of the box [3]. But it still seems like Mythos is another step up.
[1]: https://cdn.prod.website-files.com/663bd486c5e4c81588db7a48/...
[2]: https://www.noahlebovic.com/testing-an-autonomous-hacker/
Once again an evaluation missing confidence intervals. “continued improvement” and “significant improvement” but without any significance testing is moot.
With many colleagues (including from AISI themselves!), we recently reviewed 445 the AI benchmarks & evaluations from the past few years. Our work was published at NeurIPS (https://openreview.net/pdf?id=mdA5lVvNcU) and we made eight recommendations for better evaluations. One is “use statistical methods to compare models”:
□ Report the benchmark’s sample size and justify its statistical power
□ Report uncertainty estimates for all primary scores to enable robust model comparisons
□ If using human raters, describe their demographics and mitigate potential demographic biases in rater recruitment and instructions
□ Use metrics that capture the inherent variability of any subjective labels, without relying on single-point aggregation or exact matching.
I would strongly recommend taking these blog posts with a grain of salt, as there is very little that can be learned without proper evaluations.
We conducted cyber evaluations of Anthropic’s Claude Mythos Preview and found continued improvement in capture-the-flag (CTF) challenges and significant improvement on multi-step cyber-attack simulations. *edit - This is the headline from article, not associated with the review.
Uh, so those charts don’t look… particularly impressive at all to anyone else?
Like, don’t get me wrong, it’s definitely an improvement, and it’s looking to be a pretty decent one too. But “stepwise”? When GPT-5 outperformed it at technical non-expert level since ~mid last year, and 5.4 pretty much matches it at Practitioner-level?
And the charts where Mythos is at the top, it’s usually only by ~7-9 percentage points. It gets an average of 6 more steps than Opus 4.6 in the full takeover simulation. It did manage to complete it as the only model, but… I mean, Opus 4.6 apparently already got pretty close?
And Opus 5 is supposed to be between Mythos and 4.6, which, going by the numbers, would seem to me a smaller jump than between 4.5 and 4.6.
If this is the model they can’t deploy yet because it eats ungodly amounts of compute, then I guess scaling really is a dead end.
I dunno. Maybe I’m reading it wrong. I’d probably be more impressed if Anthropic hadn’t proclaimed The End Times Of Cybersecurity Are Upon Us. And I’d be happy to be proven wrong?
edit:
> We expect that performance on our evaluations would continue to improve with more inference compute: we ran the cyber ranges with a 100M token budget; Mythos Preview’s performance continues to scale up to this limit, and we expect performance improvements would continue beyond that.
Right, so this isn’t the ceiling, it’s just a ceiling at that token allocation. If they were seeing continual improvement up to that limit, then it does stand to reason that bumping the limit further would also bump performance. But then that makes me wonder what effect that would have on the other models. Does the gap grow? Shrink? Stay the same?
So around $10K for a full network takeover with Mythos in 'The Last Ones' (a 32-step simulated corporate network attack). Some limitations from the paper on arxiv (emphasis mine):
- No active defenders. Real networks have security teams monitoring for intrusions, responding to alerts, and adapting defences. Our ranges are static, for example our deployment of Elastic Defend was not configured to block or impede attack progress.
- Detections not penalised. We measured triggered security alerts but did not incorporate them into overall performance scores. A model that completes more steps while triggering many alerts may be a lesser threat than one that is able to reliably remain undetected.
- Vulnerability density varies. Our ranges are designed to have vulnerabilities; real environments are not.
- Lower artefact density than real environments. Our ranges contain fewer nodes, services, and files than typical production networks, reducing the noise a model must navigate. While substantially more complex than CTF-style evaluations, our ranges remain considerably simpler than real enterprise environments.